You need to email people on your list. But don’t know the best time to send. You want to publish a blog post, but don’t know the best day to publish. Sound familiar?
We’ve all read the theories. Just the other day, I was reading that blog posts get higher reads (or was it engagement) during the weekends. It’s very tempting to try these techniques. Especially when these case studies are backed by copious, impressive stats.
But how do you know that is true of your own website? You know the typical response. Test it. OK… how? Where do you begin? Well I’m here to tell you, you don’t need to buy another tool. You don’t need to set up some complicated tracking system. If you use Google Analytics, you already have the answers.
That’s a relief! Now here comes the problem. It’s not a built in stat. You do have to do a little bit of configuration.
Don’t panic. It’s easy and can be done in just a few steps. We’ll walk you through below.
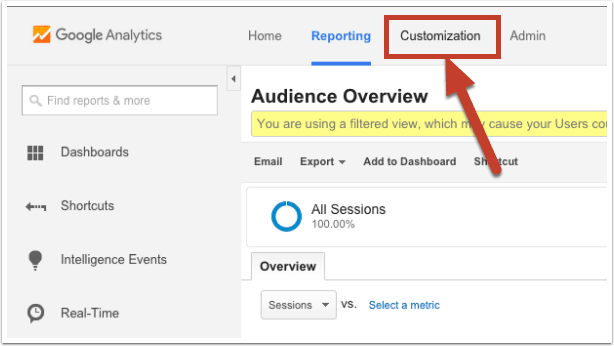
Step 1: Log Into Your Google Analytics Account
There’s a good chance you will end up in the Reporting tab after you log in. Click over to the Customization tab.
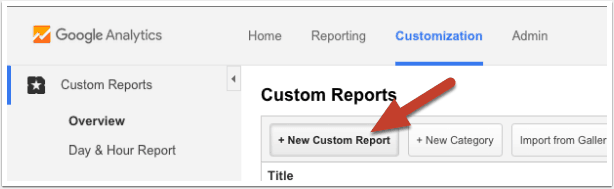
Step 2: Create New Custom Report
Once in the Customization tab, click the +New Custom Report button.
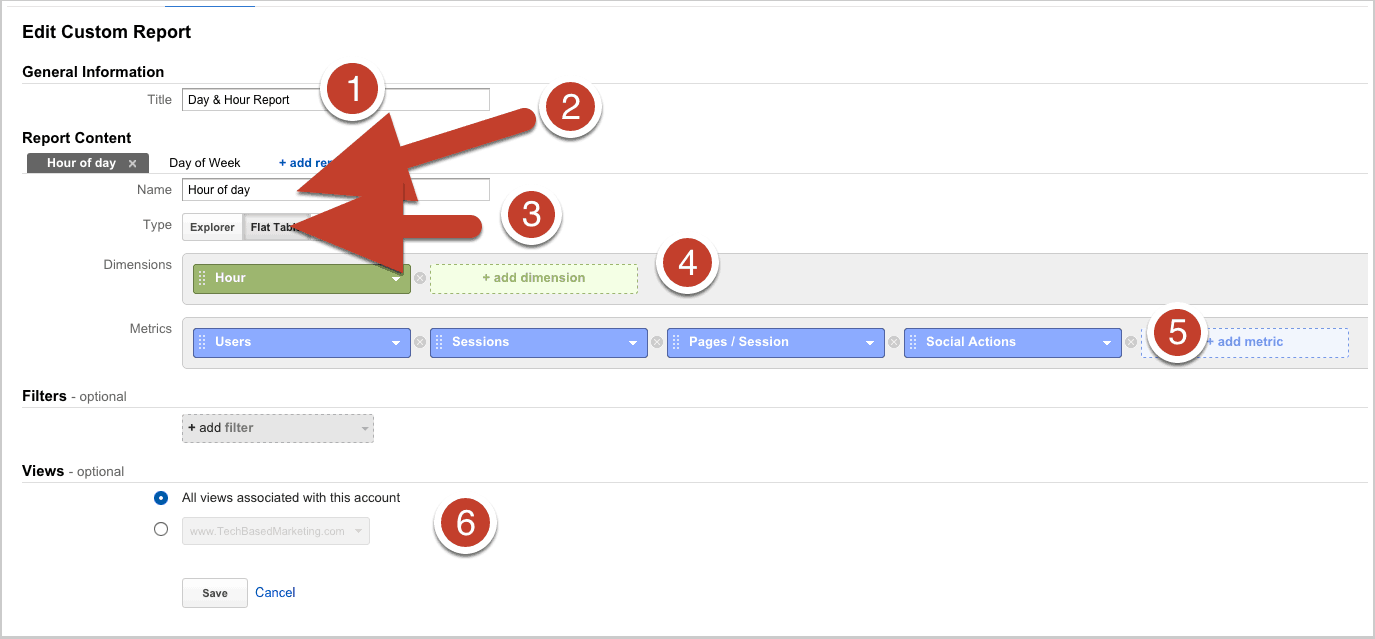
Step 3: Create An Hour of Day Report
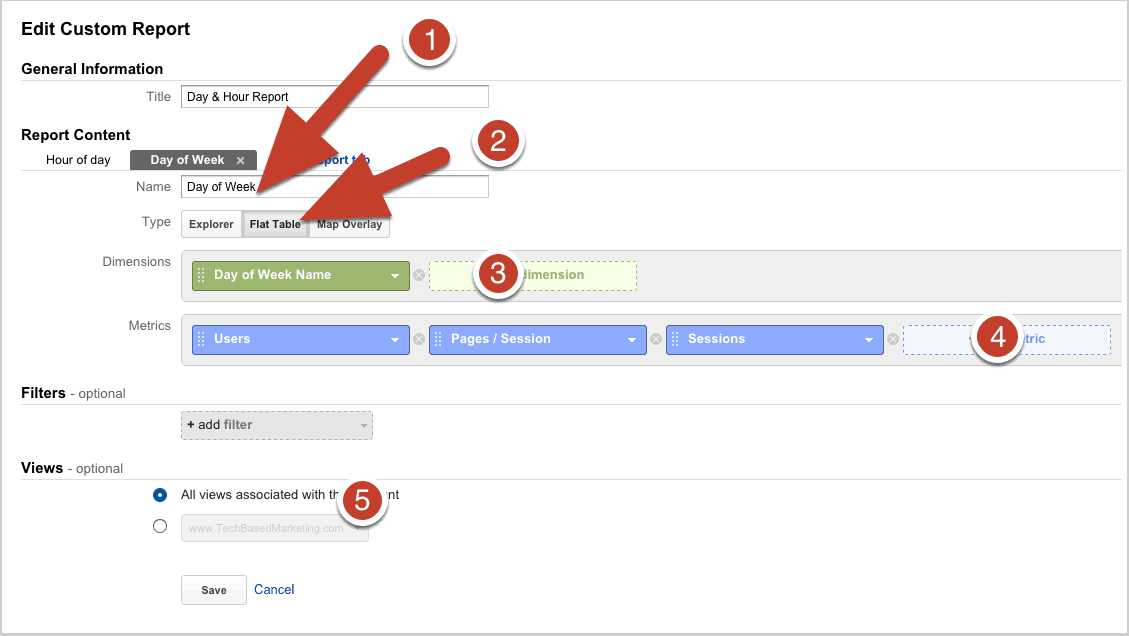
Before you do the other things, give your report a title. I entered Day & Hour report.
- To create an hour of day report, Enter “Hour of Day” in the name. You can name this anything you feel is a better descriptor.
For Type, choose Flat Table - For Dimensions, choose (or type) Hour. Not other Hour options. Just Hour.
- For Metrics, choose (or type) Users. This gives you the number of people on the site during the chosen reporting time. It includes return visitors. Everybody. You can stop here if you wish. Or you can add more Metrics. In this example, I also added Pages per Session and Sessions just to see what the stats look like. I highly encourage you to choose different metrics. This way, you can better understand the different metrics available to you and also you might uncover interesting information.
- For Views – by default, Google chooses the current property. I have decided to use All views associated with this account so that this report is available to use on other sites in my account.
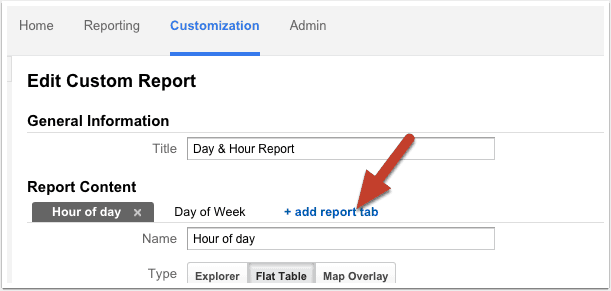
Step 4: Add Another Sub-Report
After you set up the Hour of Day report. You might want to create another one. In my case, I wanted to create a Day of Week report. Before you repeat the steps, don’t. You don’t have to start a new report. You only need to add a new report tab. So click the +add report tab link.
Step 5: Create Day of Week Report
Now you can repeat the steps for report content. This is what I’ve done.
- Named the tab Day of Week.
- Chose Flat Table Type
- Chose (or typed) Day of Week Name. This gives you the name of the Day e.g. Monday, Tuesday etc. You can choose Day of Week, if you prefer. That gives you the day number e.g. 0 for Sunday, 1 for Monday. I find Names easier to read.
- Choose your metric type. I’ve largely chosen the same ones. Should probably add social interactions too so they can be compared.
- Once again, I chose All views associated with this account.
Step 6: Check Your Report
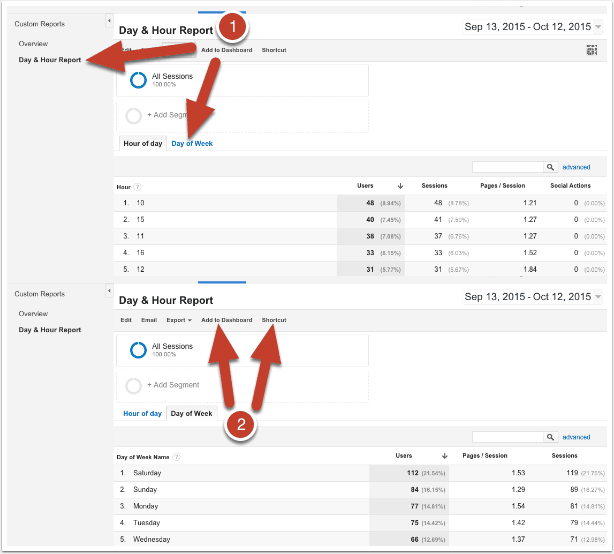
Now, when you click on the Day & Hour Report link on the left, you will see the results. To view Day of Week, click the tab to switch.
This is where you would come to view this report. If you’d like easier access, you can either Add to Dashboard or click Shortcut.
Digging Deeper
All that is a great start. But you may be thinking it’s too generic. What if you want to know the best days and hours for your email or social media click throughs. You can do that too.
Start by tracking the links you share and email. Bookmark the Google URL Builder. Each time you want to share or email a link, run it through the builder to create a URL with the right tracking parameters. These will show up in Google Analytics
Once you do that, in your custom report, you can start create new reports. Here’s an example for my Day of Week by Source/Medium report.
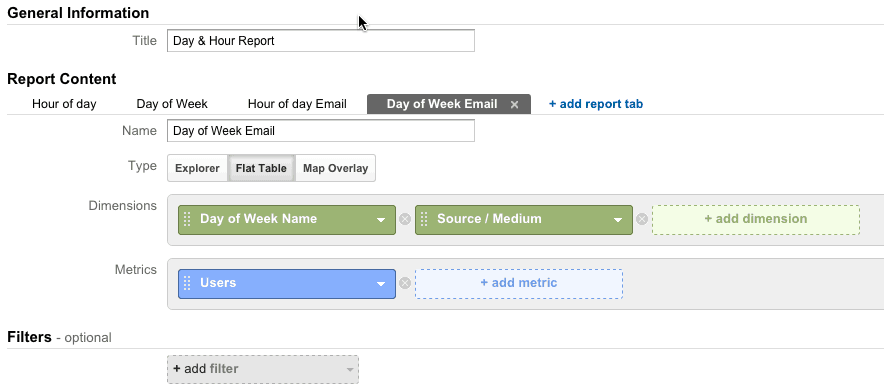
Now, you can use these reports to help you figure out good days and times to email or publish new content, based on your visitors’ habits. Not other people’s data.